| |
|
|
|
|
|
|
|
|
|
|
|
|
|
|
| |
|
| |
|
|
| |
General Purpose
Digitizing Program
|
|
| |
|
|
|
|
| |
|
| |
|
| |
|
|
| |
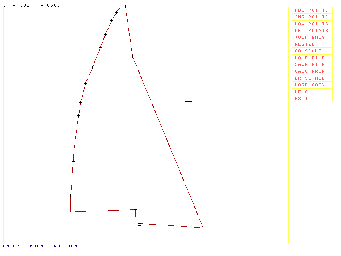
This is a general
purpose program which allows you to
define and modify a set of points that
describes a planar shape or curve.
To operate this program you place a
scaled drawing of the data on the
digitizer tablet and enter the data
points with the tablet's stylus or
cursor. An "edit window"
is displayed on the computer screen that
follows your progress as you enter and
edit the data. You select editing
and control commands from a menu located
to the right of the edit window.
The program lets you define straight
lines or curved segments on a
point-by-point basis. Once you have
entered the information into the program,
you can then calculate the area, moments,
inertias, centroid and arc-length of the
defined shape.
|
|
| |
|
|
|
|
| |
|
| |
|
 |
|
| |
|
| |
|
| |
|
|
| |
The information
you have entered into the program may be
written to a file, sent to a
2-dimensional CAD package, or plotted at
any scale factor on your plotter.
In addition, you may use the file to send
the information to our report-quality
graphing program, or to load the
information back into this program for
further editing.
This program eliminates the need for an
integrator or planimeter and can be used
for tasks such as the calculation of the
neutral axis of a midship section.
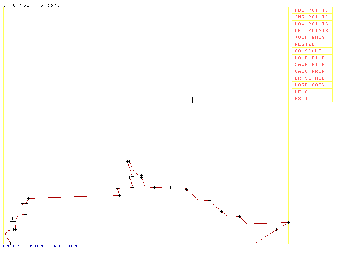
Another example is to digitize points
from a graph in a journal or
magazine. These points can then be
directly read into the graphing program
whereupon a polynomial least-squares
curve can be fit through them and its
coefficients displayed. These
coefficients then give you a convenient
way to calculate points on the graph.
|
|
| |
|
|
|
|
| |
|
| |
|
| |
|
|
| |
HIGHLIGHTS
o Digitizes arbitrary shapes and
stores them in files
o Straight and curved lines may be
digitized
o Calculates area, centroid,
moments, inertias, and arc length of
closed segments
o Different scale factors for X and
Y axes can be handled
o Automatic cursor dimensioning
displayed on the screen
o Drawing can be edited after it
has been digitized
o Tablet buttons can be defined by
the user
o Enlarging or "zooming"
can be done for detailed digitizing
o Digitized points can be saved or
retrieved from files
o A plot of the digitized drawing
can be produced at any scale factor;
allows verification of the digitized
points
o Detailed help instructions
available on-line
o Digitized points can be
immediately read into the General Purpose
Graphing Program
|
|
| |
|
|
|
|
| |
|
| |
|
 |
|
| |
|
| |
 |
|
| |
|
| |
|
| |
|
|
| |
General Purpose
Graphing Program
|
|
| |
|
|
|
|
| |
|
| |
|
| |
|
|
| |
This is a general
purpose program used to perform plotting
and analysis of datasets. Up to 15
datasets can be read into the program
from a variety of files with a flexible,
free-format read routine. Using
default values, these datasets can then
be plotted and analyzed with little or no
additional input.
You also have complete control over many
parameters of the axes and curves, such
as the X-label, Y-label, and title, along
with the "tick mark" labeling
and grid specification. For data
analysis, you can plot various types of
markers at each point, curvefit the data,
or fit a least-squares curve through the
data. A variety of regression fits
can be plotted, with the option of
displaying the resultant coefficients and
statistical information.
|
|
| |
|
|
|
|
| |
|
 |
|
| |
|
| |
|
| |
|
|
| |
This program is
set up to allow you to easily and quickly
plot arbitrary sets of data using files
from various sources. It also
allows you to refine the graph until it
is suitable for inclusion into a report
or proposal. Finally, the graphs
can be plotted at any size or scale
factor.
|
|
| |
|
|
|
|
| |
|
 |
|
| |
|
| |
|
| |
|
|
| |
This program works
well with the General Purpose Digitizing
Program in that it will automatically
read digitized data files saved by that
program. With this combination of
programs, you can quickly digitize data
from many sources, graph the data using a
variety of least-squares techniques, then
finally, obtain the coefficients of the
regression fit.
|
|
| |
|
|
|
|
| |
|
| |
|
 |
|
| |
|
| |
|
| |
|
|
| |
HIGHLIGHTS
o Produces graphs suitable for
immediate use in reports
o User definable labels, tick
marks, and curve styles
o Default values used to allow
quick plots
o Up to 15 datasets can be plotted
on one graph
o Input read from any file using
free-format technique
o Datasets given names to allow
easy plot definition
o Graphs can be plotted using any
size or scale factors
o A variety of point styles can be
plotted
o Data points can be curvefit or
least-squares curfevit
o Regression fits include
polynomial, logarithmic, exponential, and
powerfit
o Statistical information about
each dataset can be displayed
o Reads data directly from files
produced by the General Purpose
Digitizing Program
|
|
| |
|
|
|
|
| |
|


